A Refined Real-User Web Vitals Tracking Web Application
Tools
Background and Challenge
At Spisek, I recognised that traditional synthetic monitoring, while valuable for controlled lab tests, often painted an incomplete picture of our users’ real-world experiences. They needed a solution capable of capturing true, in-situ Web Vitals directly from end users to ensure they were optimising for the metrics that matter: actual page load behaviour, interactivity, and visual stability. Without this, we faced blind spots in our performance strategy, slow feedback loops after deployments, rising bounce rates, and missed SEO opportunities.
Role and Responsibilities
As the sole architect and developer of RUM Vitals, I:
- Drafted the initial proposal outlining goals, architecture, and business case.
- Built the client-side tracking library integration (using the open-source web-vitals.js).
- Designed and implemented the end-to-end data pipeline, from SQL ingestion to Pandas-based processing.
- Crafted the Flask-powered dashboard and front-end visualisations (Chart.js, Jinja HTML/CSS).
- Owned every phase: requirements, development, testing, deployment, and iteration.
Solution and Implementation
Data Collection
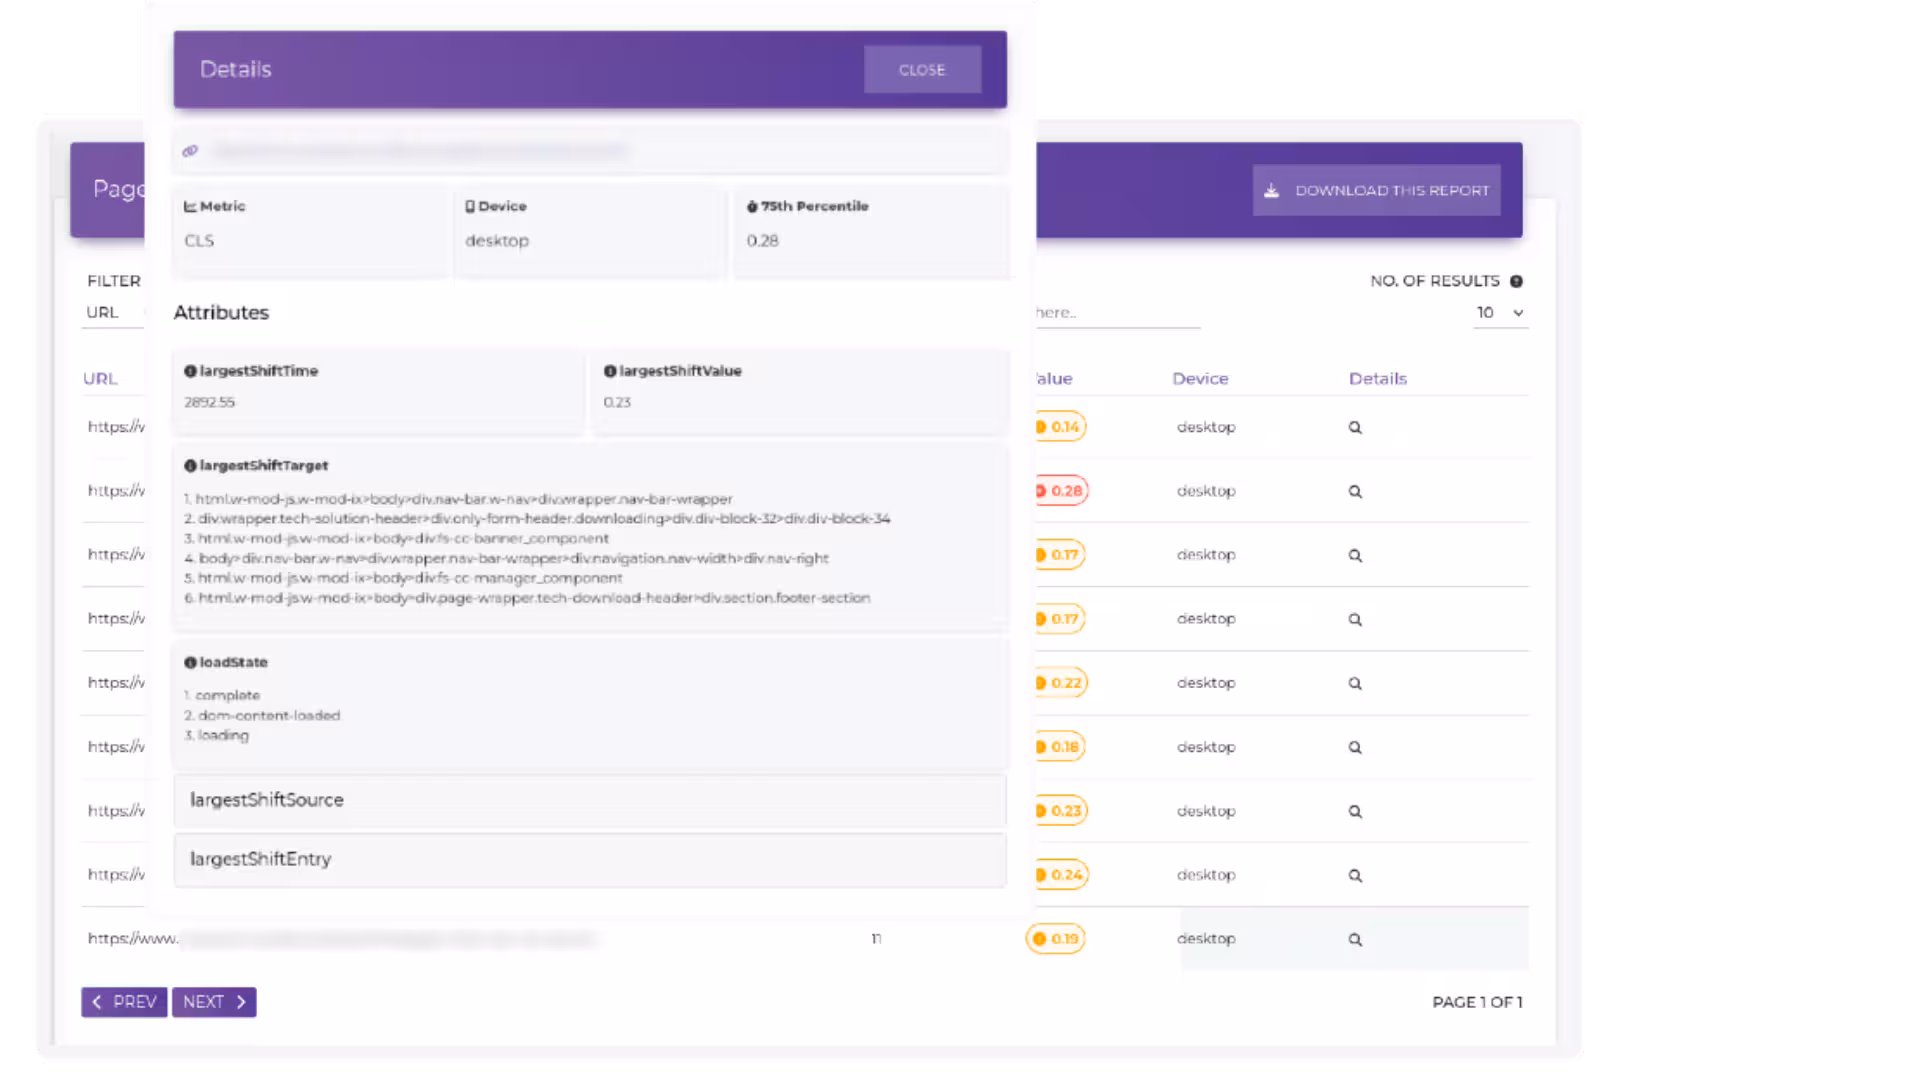
- Library: Leveraged web-vitals.js to capture 100+ attributes across the five core metrics (LCP, FCP, INP, CLS, TTFB).
- Augmented Context: Extended beacon payloads with custom data (user geolocation, network speed, device storage, OS).
- Deployment: A lightweight JS snippet, configured via a projectId parameter, was injected into the site footer.
Server-Side Ingestion
- API Endpoint: Receives beacons, validates the projectId, and writes records in real time to a dedicated SQL database (MySQL).
- Scalability: Schema optimised for high write throughput, partitioned by project and date.
Data Processing
- Batch and Stream: Python services poll new records every five minutes.
- Pandas Pipeline: Cleans, aggregates (rolling windows, percentiles), and computes trend indicators.
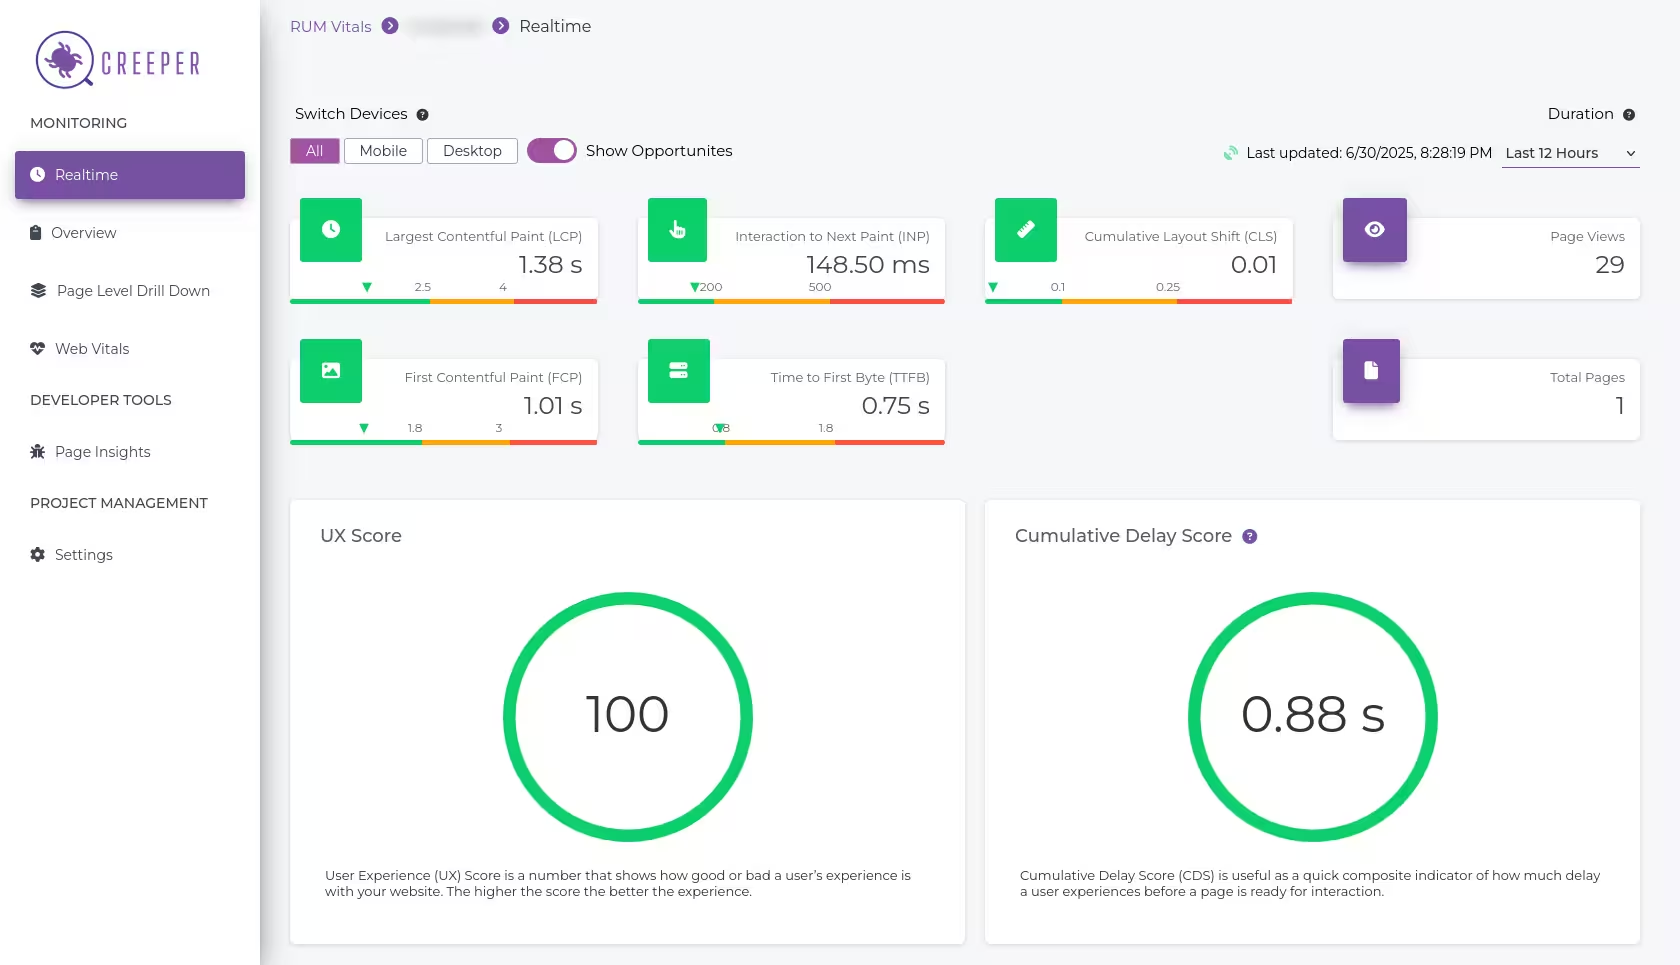
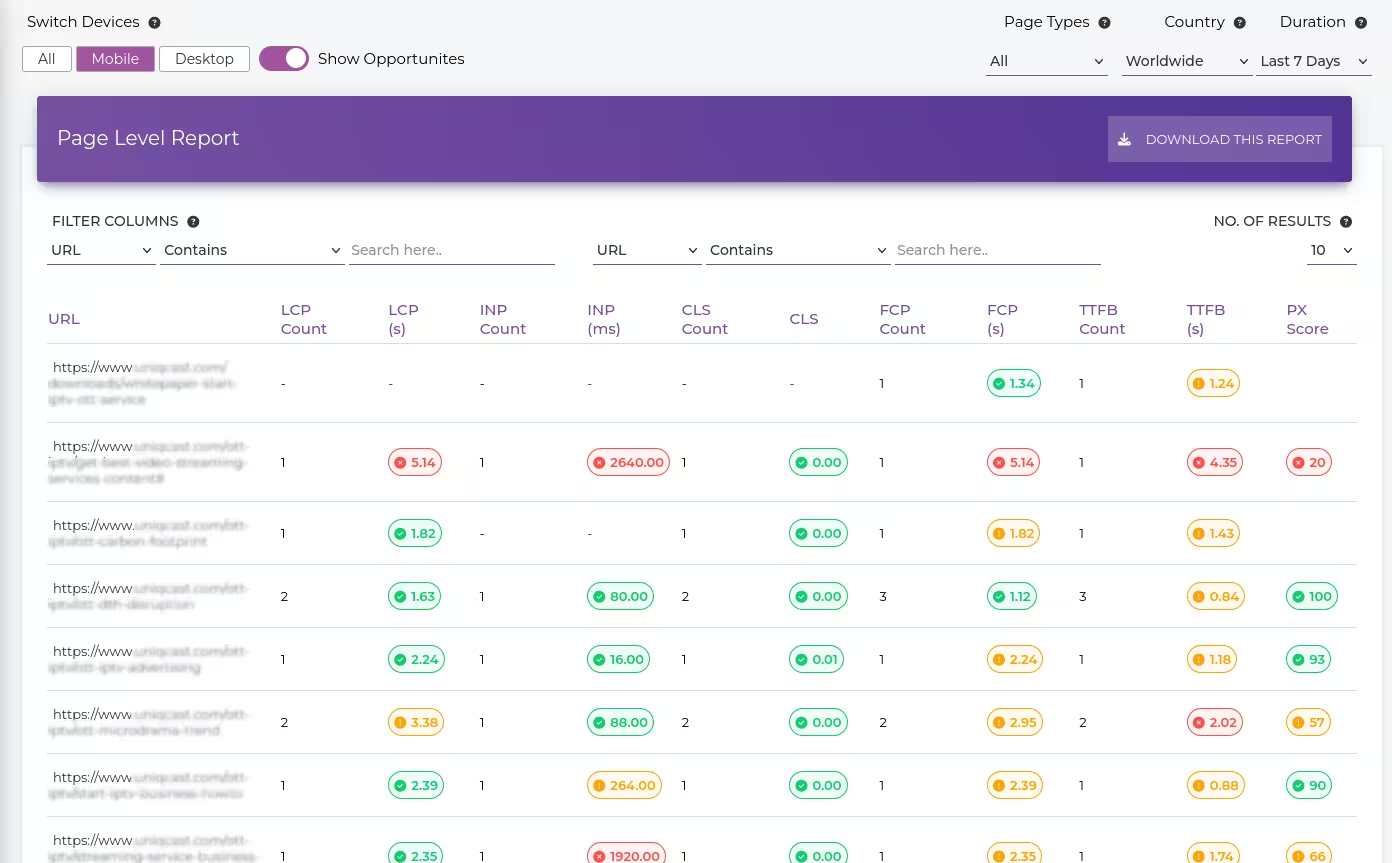
Dashboard and Visualisations
- Backend: Flask app exposes REST endpoints for filtered queries.
- Front-End:
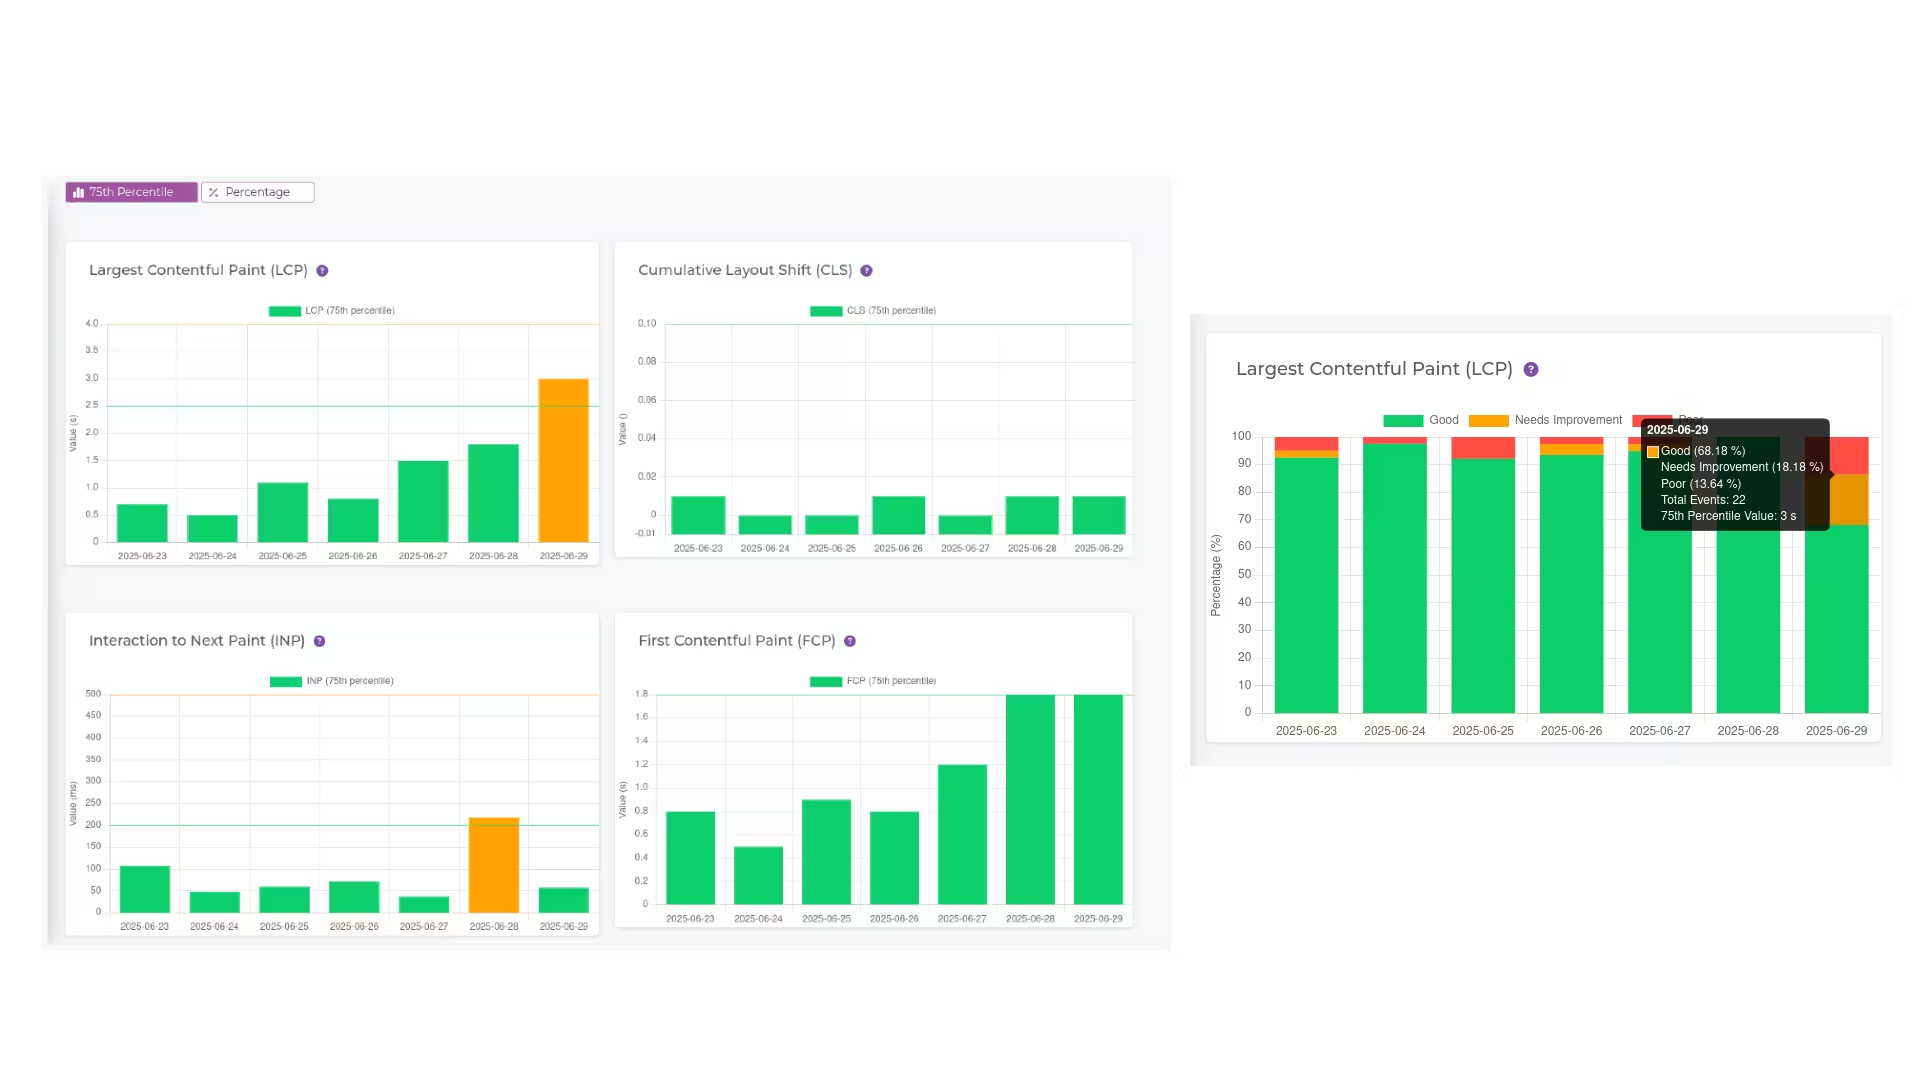
- Chart.js for interactive time-series graphs.
- Jinja HTML/CSS for responsive layouts and templating.
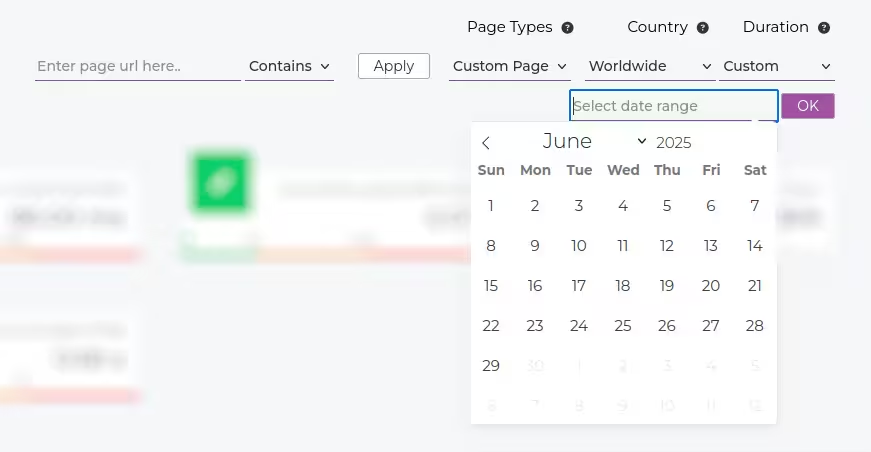
- Custom Filters: Device type, geographic region, network tier, and URL pattern.
- “Show Opportunities” Toggle: One-click filter to surface pages failing any core metric.
Enterprise-Grade Add-Ons
- GDPR-compliant consent flows and anonymisation.
- Dedicated on-premise API server option.
- Live training sessions and optimisation consultation.
Business Impact and Metrics
- Faster Issue Detection: Performance regressions, once a days-long detective effort, now surface within five minutes of deployment.
- SEO Gains: Organic search visibility climbed by an average of 6 positions for clients whose FCP and INP were consistently meeting thresholds.
- New Business: Demonstrable, real-user performance logs were critical in winning annual contracts for Spisek.